Confluence's built-in Chart macro can draw a line chart, but many teams find it hard to make it look like the chart they would build in Excel: clear axes, light gridlines, two or three lines in different colours with a legend, and a sensible size.
The CelesteCS Chart macro from CelesteCS Math for Confluence draws exactly that from a normal table on the page. The table stays the single source: change a number and the chart follows on the next page view.
Checked on Confluence Data Center 9.2 with Math 27.5.0; the same parameters work in Confluence Cloud.
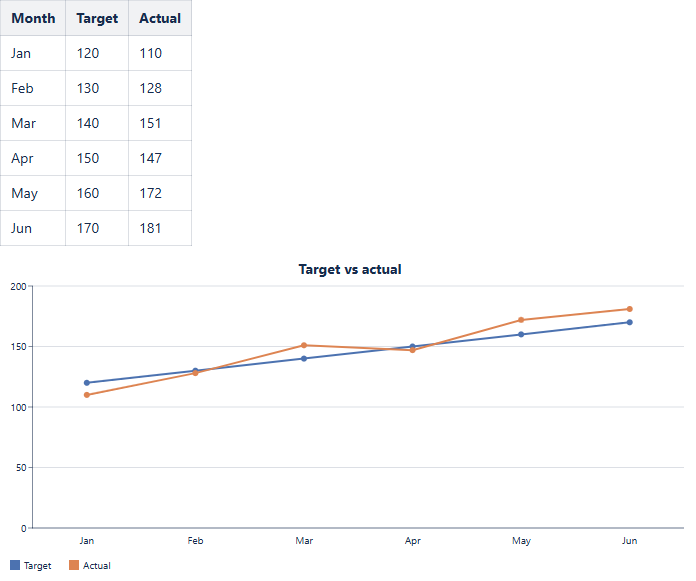
Settings used
Put the numbers in a plain table (here: Month, Target, Actual), then add CelesteCS Chart below it:
- Chart type: Line
- Data range:
Table1.B2:B7; Table1.C2:C7– one range per line, separated by a semicolon (up to 10) - Labels range:
Table1.A2:A7– the months along the bottom - Series names:
Target, Actual– shown in the legend - Axes: Axes and gridlines
- Colors:
#4C72B0, #DD8452– one colour per line - Width / Height: 700 / 320 pixels
- Title: Target vs actual
Good to know
- The data can come from another page too:
[SPACE:Page title]Table1.B2:B7. - Instead of typed numbers, the table cells can hold CelesteCS Math formulas, for example sums from other tables or counts of Jira work items, and the chart plots their results.
- The chart follows the dark theme, and an existing chart without the new settings looks exactly as before.
- Bar charts take the same settings; Pie charts take Colors and the size.
Related: Charting your Confluence tables with the Chart macro and a weekly trend chart of Jira issue counts.
Try it in your own Confluence: CelesteCS Math for Confluence on the Atlassian Marketplace – free trial for Cloud and Data Center.
Math saves you time? A review on the Marketplace – Math – helps other teams find it.