Conditional Data Bar macro draws an in-cell bar whose length is proportional to the cell’s numeric value, relative to the specified minimum and maximum of the range. This macro must be used inside Conditional Rules Manager macro.
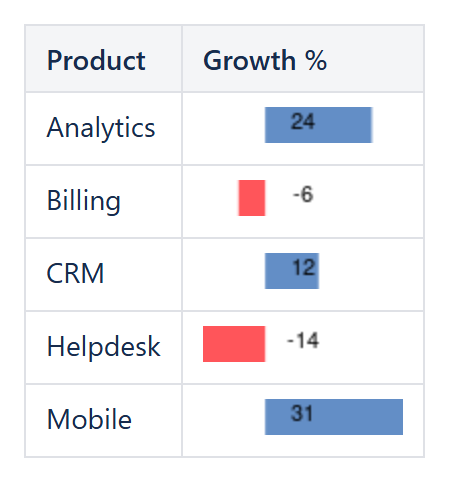
Example: data bars on growth values - negative values grow to the left in the negative bar color.
New!
Conditional Data Bar macro does the following:
- computes each cell’s value as a percentage of the way from Minimum value to Maximum value, as defined by the Minimum value type/Maximum value type parameters;
- draws a bar inside the cell, filled to that percentage, in Bar color;
- for negative values, the bar grows from zero toward the left instead, in Negative bar color – the same way Excel’s own data bars handle negative values;
- optionally shows the cell’s original value as text alongside the bar, controlled by Show value.
Conditional Data Bar macro has the following parameters:
| Parameter | Description |
|---|---|
| [Enum] Minimum value type (default='Lowest value') | The type of the minimum value to be used. Based on this type Minimum value parameter value may have to be specified. May have one of the following values:
|
| [String] Minimum value (default=empty) | The value parameter – either constant or percent value should be specified, based on the Minimum value type parameter value. |
| [Enum] Maximum value type (default='Highest value') | The type of the maximum value to be used. Based on this type Maximum value parameter value may have to be specified. May have one of the following values:
|
| [String] Maximum value (default=empty) | The value parameter – either constant or percent value should be specified, based on the Maximum value type parameter value. |
| [String] Bar color (default='#638ec6') | The color of the bar for non-negative values. Standard CSS color names, Confluence highlight color names and colors in HEX notation (#rrggbb) are supported. |
| [String] Negative bar color (default='#ff555a') | The color of the bar for negative values. Standard CSS color names, Confluence highlight color names and colors in HEX notation (#rrggbb) are supported. |
| [Boolean] Show value (default=true) | Specifies whether to show the cell’s original numeric value as text alongside the bar. Supported values are true (default) and false. |
| [String] Applies to (default='All tables') | Specifies the cells to apply conditional formatting to.
|
When the parameters are set, an example of the data bars, filled from Minimum value to Maximum value, may be seen at the preview pane of the macro editor. Press “Preview” button after changing parameters to see the result.