Reporting Table View macro is a container for other Reporting macros. It is used to gather all the macros, used to form the table report. It should contain one Data Provider macro (Reporting Jira Data Provider macro, Reporting Confluence Data Provider macro or Reporting Json Data Provider macro) and one to many Reporting Table Item macros. Data providers read data from appropriate sources and form it as JSON data. Reporting Table Item macros take appropriate fields from data providers and use them as values of the column cells.
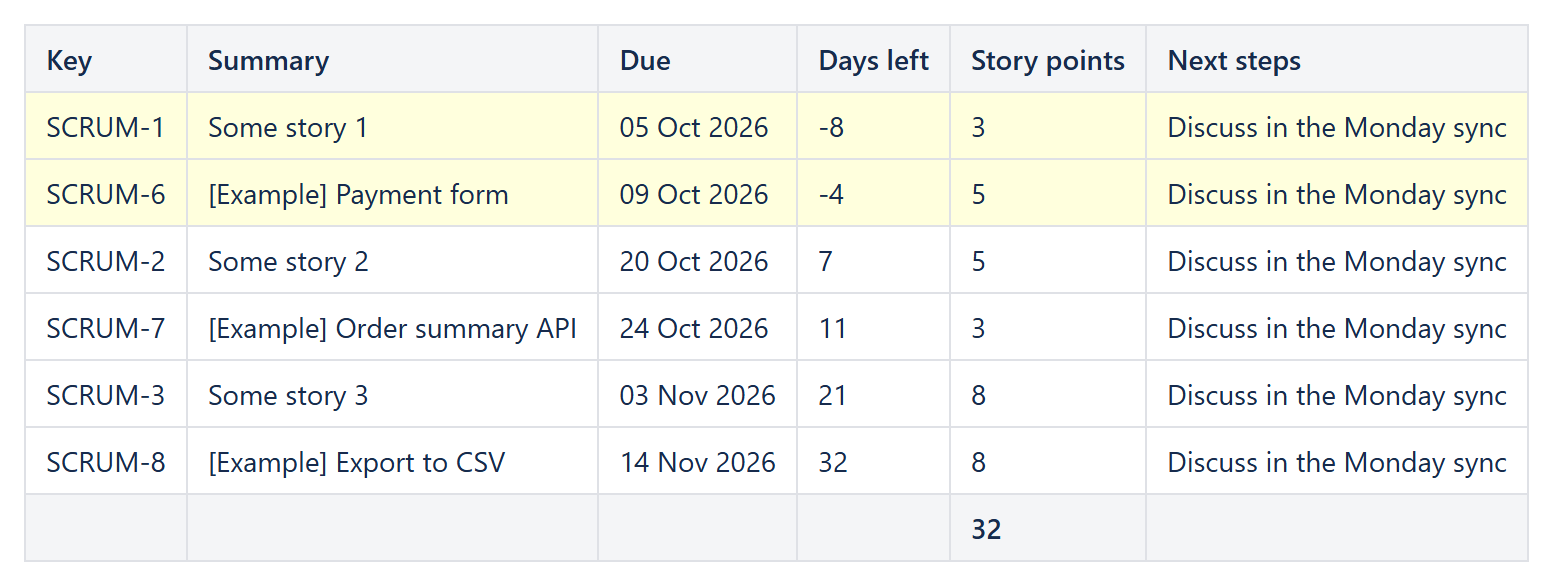
Example: a Reporting Table View over Jira stories - formatted dates, a calculated column, a footer total and highlighted overdue rows.
Reporting Table View macro has the following parameters:
| Parameter | Description |
|---|---|
| [Enum] Decimal symbol (default='.(dot)') | Specifies symbol used to separate the integer part from the fractional part of a value. Supported values are ".(dot)" (default) and ",(comma)". |
| [Enum] Digit grouping symbol (default='(no grouping symbol)') | A symbol used to separate the groups of digits of a value. Supported values are "(no grouping symbol)" (default), " (space)", ".(dot)", ",(comma)" and "'(apostrophe)". |
| [String] Empty response text content (default='No data.') | This text value will be shown when zero items were returned on the specified request. (Technical) In case of Jira and Confluence data providers this text is shown when search requests returned code 400. |
| [Enum] Empty response text output type (default='Plain text') | The way how the Empty response text will be pre-processed before writing to the page. May have one of the following values:
|
| [Boolean] Load macro dynamically (default='False') | If turned on, only a small placeholder is loaded with the page and the report is loaded right afterwards, so the page does not wait for the report. Confluence 10.x Supported since Reporting 12.1.0 (Data Center). Confluence 9.x Since Reporting 12.1.0 the option is ignored and the report is rendered when the page is displayed (earlier versions showed an error message instead of the report). Not applicable to Cloud. |
| [String] Caption (default=empty) New! |
An optional text caption shown as an accessible <caption> element right after the table's opening tag, above the header row. |
| [String] Table CSS class (default=empty) New! |
An optional space-separated list of extra CSS class names to add to the rendered <table> element, in addition to the standard 'confluenceTable' class it always carries. Only letters, digits, underscore, hyphen and spaces are kept – any other character is stripped. Together with Table CSS class, header cells are now rendered with a 'scope="col"' attribute for better screen-reader accessibility. |
| [String] Sort (default=empty) New! |
A comma-separated list of JSON field paths (same dotted notation as used in a Reporting Table Item's content formulas) to sort the fetched rows by, applied before Distinct and Limit and before any column formulas are evaluated. A leading '-' on a key sorts that key descending (a leading '+' means explicit ascending). Each key may optionally end with a type hint – ':number', ':date' or ':text' – to force how that key is compared; without a hint, the comparison is numeric when both sides parse as numbers, otherwise a case-insensitive text comparison. Rows with a missing value for a key always sort last for that key. Example: 'created:date,-points:number'. |
| [String] Distinct (default=empty) New! |
A comma-separated list of JSON field paths forming a composite key; only the first row with each distinct combination of values is kept. Applied after Sort and before Limit. |
| [Int] Limit (default='0') New! |
The maximum number of rows to keep, applied last (after Sort and Distinct). A value of 0 or less means no limit. |
| [Enum] Filters for readers (default='None') New! |
'Search and column filters' gives the people who view the page a toolbar above the table: a search box over all cells, a drop-down value filter for every column with repeating values, sorting by a click on a column header (click again for descending), an "X of Y rows" counter and a Reset button. Footer aggregates (Sum, Average, Count, ...) are recalculated over the visible rows. Nothing is saved: each reader filters their own view, and the page and the report configuration stay unchanged. 'None' (the default) keeps the plain table. See Filters for readers below. |
Filters for readers
With Filters for readers set to Search and column filters, the report becomes interactive for everyone who opens the page:
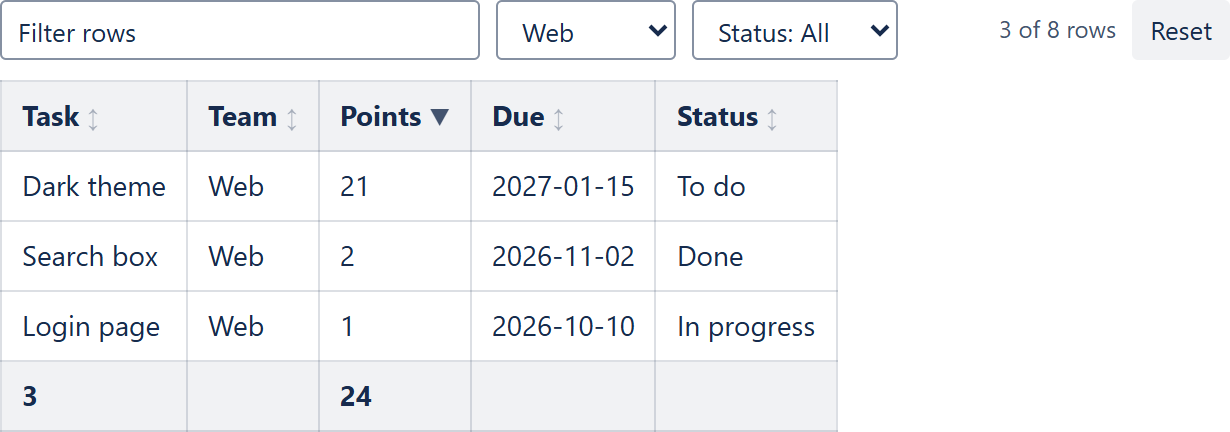
- Search – type any text; rows that contain it in any cell stay visible.
- Column filters – a drop-down for every column whose values repeat (status, assignee, category, ...); combine several.
- Sorting – click a column header; numbers, currency and dates are sorted by value, not as text. The keyboard works too (Tab to the header, Enter).
- Totals follow the filter – footer aggregates are recalculated over the visible rows, so a filtered table shows the sum of what you see.
- Reset clears the search, the filters and the sorting.
The data and the formulas are not changed: the report is calculated as before, and the filters only show or hide its rows in the reader's browser. Row highlighting (Highlight when) and links in cells keep working after filtering. The filter applies to the rows of the report; to limit what the report fetches in the first place, use the data provider's query and the Table View's Filter when condition.
Works on Confluence Cloud and Data Center (9.2 – 11), also together with Load macro dynamically and with several reports on one page.
More examples
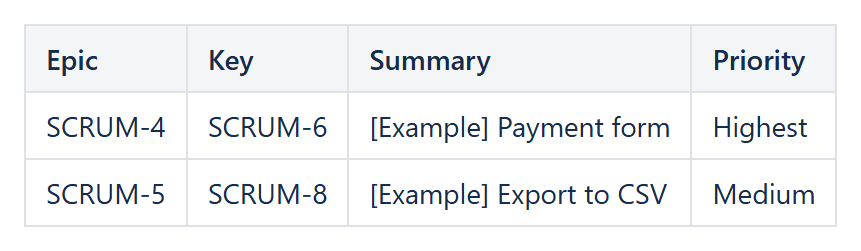
Example: Sort = fields.priority.id:number and Distinct by = fields.parent.key keep the highest-priority story of each epic.
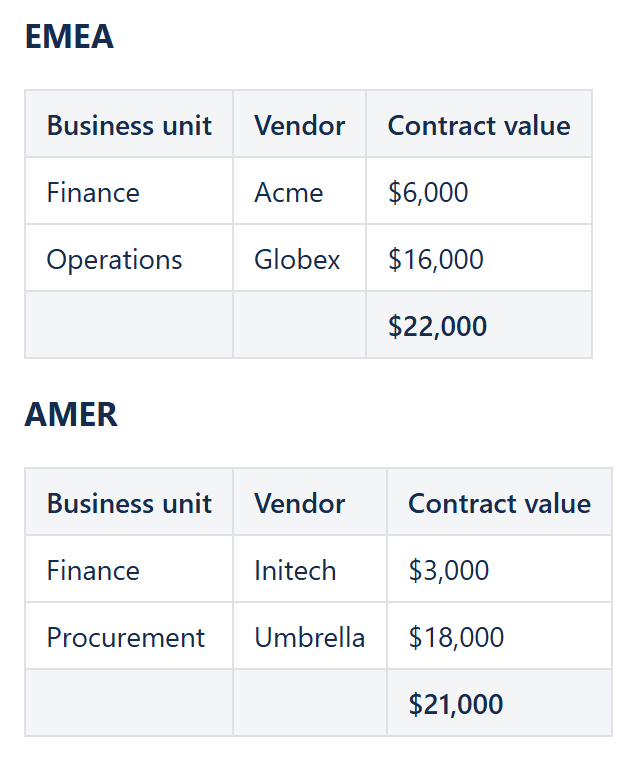
Example: one Table View per region, each with its own Filter such as CurrentItem.region = "EMEA" and its own footer total.