An executive overview of a portfolio of epics usually needs three things on one screen: how many epics are in each status, how far each epic has come, and whether it is on track. A Confluence page can show all three, live from Jira: CelesteCS Math for Confluence counts the issues and draws the chart, and CelesteCS Conditions for Confluence turns a Red / Amber / Green health column into colored status lozenges.
Works on Confluence Cloud and Data Center. On Cloud insert the Cloud variants of the macros.
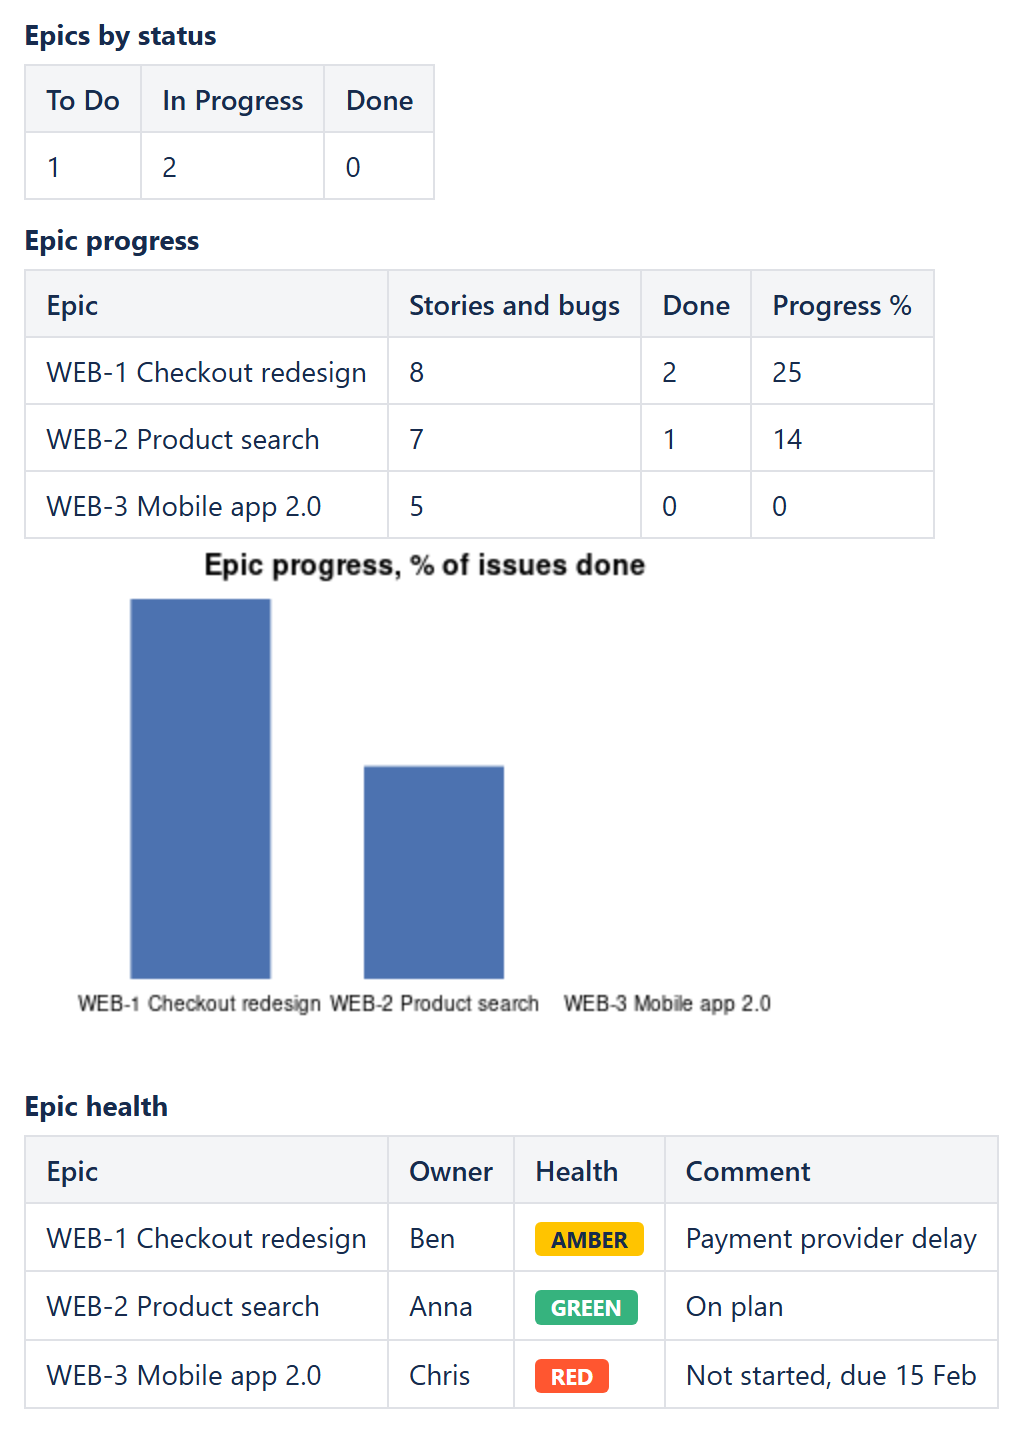
1. Epics by status
A small table with one Numerical Expression macro per cell:
| Column | Formula |
|---|---|
| To Do | JIRAISSUECOUNT("project = WEB AND issuetype = Epic AND statusCategory = 'To Do'") |
| In Progress | JIRAISSUECOUNT("project = WEB AND issuetype = Epic AND statusCategory = 'In Progress'") |
| Done | JIRAISSUECOUNT("project = WEB AND issuetype = Epic AND statusCategory = Done") |
Use single quotes inside the JQL so they do not clash with the double quotes of the formula.
2. Progress per epic
One row per epic. The first two numbers come from Jira, the percentage is calculated from the cells next to it, so the page asks Jira only twice per epic:
| Column | Formula (row 2) |
|---|---|
| Stories and bugs | JIRAISSUECOUNT("parent = WEB-1") |
| Done | JIRAISSUECOUNT("parent = WEB-1 AND statusCategory = Done") |
| Progress % | ROUND(Table2.C2 / Table2.B2 * 100, 0) |
In Jira Cloud parent = WEB-1 returns every story and bug of the epic; on Data Center use "Epic Link" = WEB-1. A CelesteCS Chart macro below the table with Data range: Table2.D2:D4, Labels range: Table2.A2:A4 and Chart type: Bar draws the progress bars.
3. Red, amber, green
Health is a judgement, so it stays with the epic owner: a third table with Epic, Owner, Health and Comment, where the owner types Green, Amber or Red. Wrap that table in a Conditional Rules Manager and add three Conditional Rules on the Health column:
- Rule condition Element text contains, Value 1
Green, Applies toTable1.C:C, Insert status color: Green - the same with
Amberand Yellow - the same with
Redand Red
Inside a Rules Manager, tables are counted from the manager itself, so the health table is Table1 there, even though it is the third table on the page.
Tip: keep the Rules Manager around the health table only, not around the tables with Jira formulas. Conditions has to render everything inside the manager before it can color it, and a manager wrapped around many Jira queries can run into Confluence's macro time limit.
4. What you get
A page an executive can open at any time: the counts and percentages are read from Jira on every view, and the health column shows the owners' latest assessment, with a comment for the amber and red ones. More progress formulas, including a burndown by issue count, are in Replacing the retired Version Report and Epic Burndown with a live Confluence page.
Try it in your own Confluence: CelesteCS Math for Confluence on the Atlassian Marketplace – free trial for Cloud and Data Center. This example also uses CelesteCS Conditions for Confluence.
Math or Conditions saves you time? A review on the Marketplace – Math, Conditions – helps other teams find them.